


I. INTRODUCTION
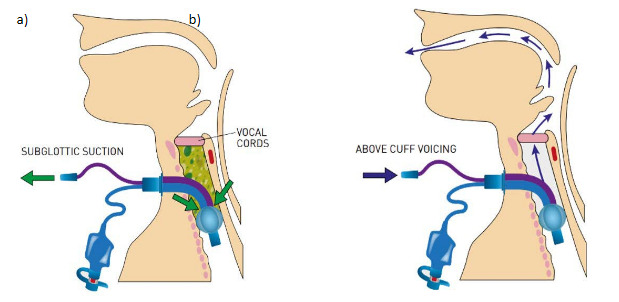
Tracheostomies are widely used in ICUs for prolonged ventilation and airway management.1,2 Their use increased significantly during the COVID-19 pandemic.3,4 The tracheostomy tube cuff is initially inflated to deliver effective ventilation and protect patients against aspiration of material into the lungs.5 An inflated cuff blocks airflow to the upper airway, meaning no airflows via the nose, mouth, or vocal cords during the respiratory cycle (Figure 1).6 This implies that patients with a cuff-inflated tracheostomy cannot vocalise despite often being conscious and alert, causing significant psychological distress, anxiety, and frustration. Restoring voice is recognised as a priority for humanisation of care.7,8

Above cuff vocalisation (ACV) directs retrograde airflow through an existing tracheostomy tube’s subglottic suction port (SGS), allowing patients to vocalise without deflating the tracheostomy cuff (Figure 1).9 Early patient studies of ACV have shown promise in restoring speech and stimulating swallow function, but research on characterising the physics of ACV airflow through the upper airway is limited.6,7,9,10 To generate voice, a series of processes focused on the oscillations of the vocal folds at varying frequencies and motions are required.11 Some research has focused on the phonation threshold pressure (PTP) and phonation threshold flow (PTF), the minimum subglottic pressure and airflow needed to start and sustain vocal fold vibration.12
Previous CFD analyses of airway models constructed from computed tomography (CT) scan data have provided important insights into respiratory airflow. For example, CFD has been used to simulate flow patterns in subject-specific trachea models and detect abnormalities such as stenoses or tumours non-invasively.13,14 It has also been applied to compare tracheostomy tube designs and quantify resistance to airflow based on tube geometry.15
Clinical studies suggest that subglottic airflows in the range of 2-5 L/min are sufficient to produce intelligible and audible whispered speech in ventilated patients.16,17 Higher airflows may be necessary for louder vocalisation but increase risks of patient discomfort, drying out the laryngopharynx, and excessive oral secretions.6,17 There is a need for physics-based modelling to better characterise the subglottic airflow dynamics that allow for optimal phonation through ACV, improving the safety and comfort of ICU patients vocalised using this method. One robust way of modelling subglottic airflow dynamics is through computational fluid dynamics (CFD) simulations.18
The primary aim of this research is to conduct CFD simulations of airflow for various cases, including non-ACV ones: a healthy airway, an airway with tracheostomy tube inserted (both cuffed and uncuffed), as alongside an airway with a subglottic suction tracheostomy tube delivering ACV. These simulations aim to enhance our understanding of airflow dynamics in patients with different pathologies under various conditions under entirely non-invasive treatments. Despite the abundance of CFD studies for non-ACV scenarios, there is a notable scarcity in the context of ACV. To address this gap, we began our work by simulating well-documented non-ACV cases to validate/verify our methodology. This was done by comparing two-dimensional (2D) simulation results with findings from three-dimensional (3D)/ experimental results reported in the literature. Once our methodology was verified, we applied it to the cases including ACV. It is worth mentioning that while 3D simulations offer better accuracy, this study employs 2D simulations as a crucial preliminary step, marking one of the first CFD application for ACV cases. By providing detailed insights into subglottic and above-cuff airflow patterns, this research aims to inform the development and optimisation of clinically applied ACV methods to promote speech in tracheostomy-ventilated patients.
II. METHODOLOGY
A. Designing Two-Dimensional Models
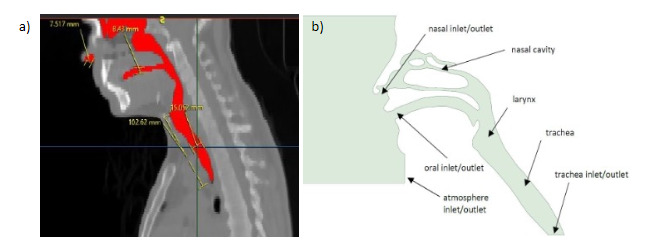
Two-dimensional (2D) models of a healthy male airway were created from CT scan data processed with Simpleware ScanIP S-2021.06. Key dimensions (trachea diameter ~15 mm, trachea length 100 mm, mouth diameter ~8.4 mm, nasal inlet ~7.5 mm) matched literature values,19–23 as shown in Figure 2(a). The 2D models incorporated nasal cavity geometry for realistic airflow simulations.
_ct_scan_of_a_healthy_middle-aged_man_highlighting_important_dimensions_used_to_design_.png)
B. Modelling Airway with Tracheostomy Tube
Model A included a 200 × 200 mm atmospheric boundary box, allowing pressure inlet/outlet conditions and accurate prediction of nasal and oral velocities, as shown in Figure 2(b). This model served as the base for additional tracheostomy tube models. Additional 2D models (B.1, B.2, and C) were created by modifying the healthy airway model to simulate different tracheostomy tube configurations (see Supplementary Information section).
For all models involving a tracheostomy tube (Models B.1 and B.2), the ends of the tube are referred to as proximal (external/ventilator side) and distal (tracheal side). During inhalation, airflow enters the proximal end of the tube and exits the distal end into the trachea. During exhalation, airflow direction reverses, entering the distal end from the trachea and exiting through the proximal end. These anatomical references remain consistent, while flow direction depends on the respiratory phase.
We employed two-dimensional (2D) CFD modelling to simulate airflow in the mid-sagittal plane of the airway. This approach captures key airflow features relevant to phonation, such as velocity jets, pressure gradients, and vortex structures along the central airway axis.19–26 While 3D modelling offers greater anatomical fidelity, 2D simulations significantly reduce computational cost and enable detailed parametric studies of flow rates and boundary conditions. Previous studies have shown that 2D models can approximate flow behaviour in the upper airway with reasonable accuracy for preliminary investigations.19,26
C. Boundary Conditions, Computational Mesh and Simulation Criteria
Table 1 summarises the boundary conditions applied to the models. Model C differs as it models ACV airflow above an inflated cuff.
After conducting a thorough mesh independence study, an unstructured mesh was generated using 64,754 cells. The simulations utilised a pressure-based solver for the steady state flow of air considering it as a Newtonian fluid with standard properties. To model the flow turbulence, the two-equation k − ω SST model was used. The pressure-velocity coupling method SIMPLE scheme is used for this study. For pressure and momentum equations, second-order spatial discretisation was used and the convergence criteria for the flow and turbulence model equations were set to 1e-06.
III. RESULTS
A. Model A - Healthy Human Airway: Validating Results
Figure 3 presents the velocity and (gauge) pressure contours from Model A, for both inhalation and exhalation at a flow rate of 18 L/min. Model A was constructed using CT scan measurements and compared to real-life anatomical literature values.20–23 Table 2 summarises the critical velocity results, with averages across a cross-section of each segment rounded to two decimal-places and compared to averaged velocity data reported in the literature.
_and_pressure_(right)_contours_for_healthy_human_airway_simulations__(a)_an.svg)
Model A results were validated against published CFD and experimental data, showing comparable velocity values in the mouth, nose, and trachea (Table 2).
Looking first at the trachea, the natural inspiration velocity of a healthy trachea is reported to vary between 1-2 m/s and 1.62 m/s.14,24,25 One reference study used here uses a CFD simulation from a 3D model but does not validate its results with theoretical or experimental fluid velocity profiles.25 Another study compares its values with other CFD simulations of 3D models.24 These values are close to those we obtained in our simulation, indicating reasonable accuracy for our results.
Regarding the nose and mouth, some studies state that the velocity inlet at both nasal and oral entries should be around 1.88 m/s,19 whereas other studies find that the inlet velocity at the mouth should be 1.96 m/s and at the nose 0.95 m/s.25,26 One literature study includes a PIV and CFD 3D airway model tested at different flow rates.26 In our study, we found the velocity in the oral entry to be 1.98 m/s, a 3% difference. The velocity in the nasal airway in our simulation had a velocity difference of 0.10 m/s, which is 10% different from that reported in the literature. A reference frequently used in our study, includes a PIV experiment and CFD study of a 3D model healthy airway at different flow rates.19 We use the velocity inlet boundary conditions they set to compare to our results.
Finally, the maximum velocity for inhalation calculated in our simulation was 3.33 m/s, only a 4% difference.19 Similarly, at exhalation, the maximum velocity was found to be 3.47 m/s. It is reported that the maximum velocity drops from 3.48 m/s at inhalation to 2.68 m/s at exhalation.24 In our study, we could not observe this reduction. Furthermore, the velocity at the trachea did decrease when compared to inhalation, but it is not comparable to 0.9 m/s.14
B. Model B - Human Airway with an Inserted Tracheostomy Tube
1. Model B.1 - Deflated Cuff
Throughout the simulations, the anatomical tube ends are referred to as proximal (external/ventilator side) and distal (tracheal side). During inhalation, air enters the tube proximally and exits distally; during exhalation, flow direction reverses, but anatomical references remain unchanged to avoid confusion.
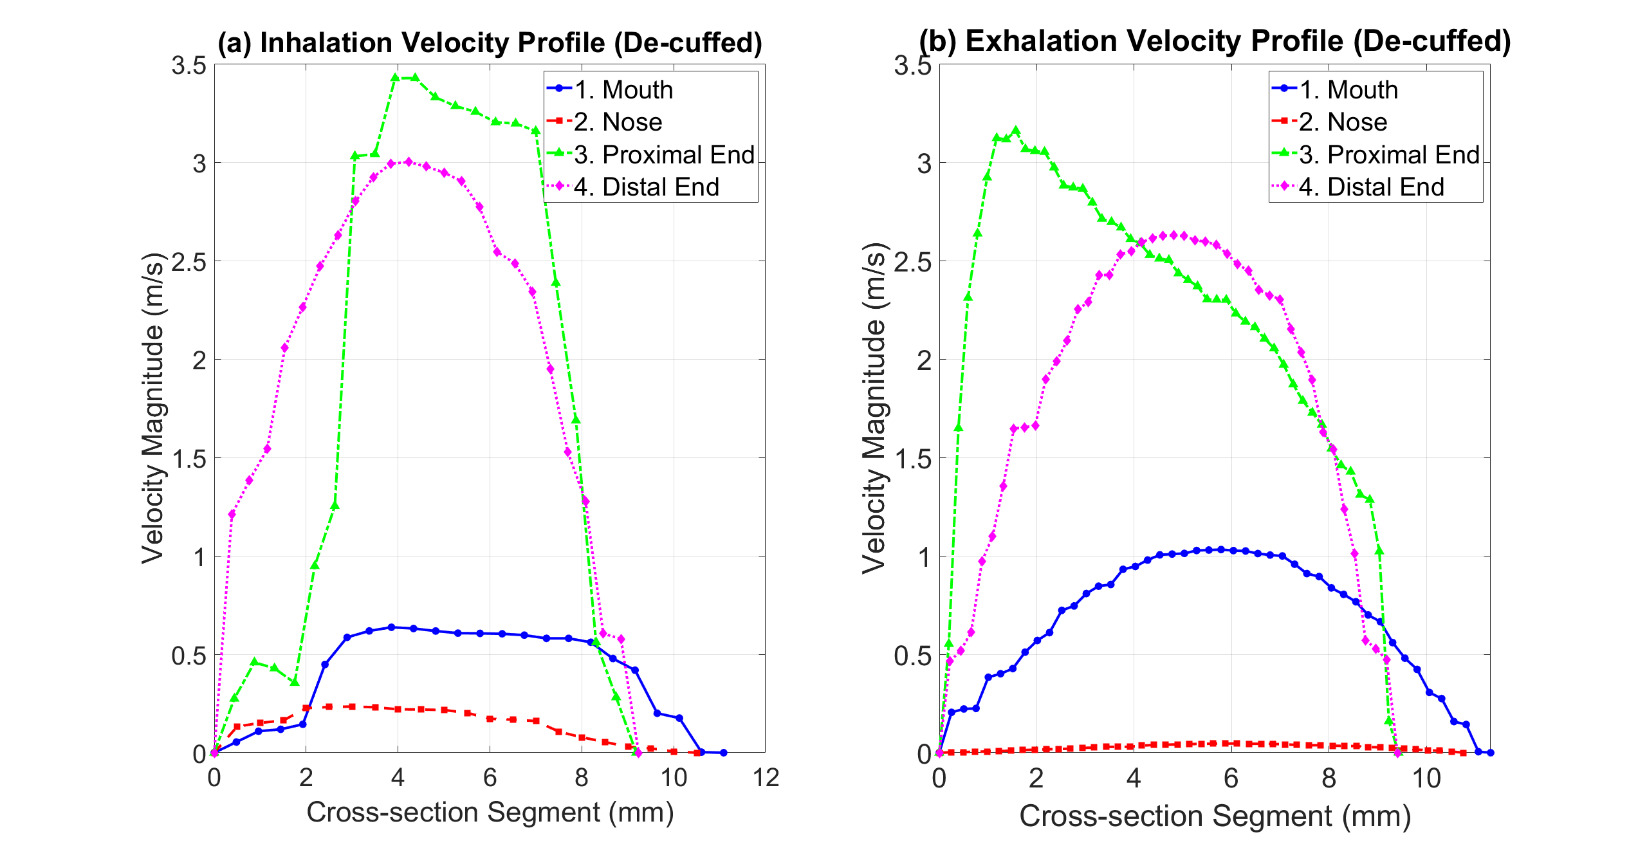
Table 3 provides an overview of the velocity and pressure values in Model B.1 during both inhalation and exhalation, based on the contours shown in Figure 4. The cross-sections 1–4 in Figure 4 and Figure 5 represent the nose, mouth, proximal end of the tracheostomy tube, and distal end of the tracheostomy tube, respectively. In Model B.1, the tracheostomy cuff was deflated (open), enabling airflow through both the tracheostomy tube and the upper airway.
During inhalation, a maximum velocity of 3.40 m/s is observed, with most airflow directed through the tracheostomy tube, resulting in reduced mouth flow and negligible nasal flow. The velocity distribution indicates structured flow through the tube, with minimal turbulence near the distal (tracheal) tube end. During exhalation, there is a slight increase in mouth flow compared to inhalation, but the bulk of airflow is exhaled through the tracheostomy tube. A greater local maximum velocity is observed at the gap between the tube and the inner trachea wall, with negligible nasal flow (Figure 4). The bulk of flow passes through the tracheostomy tube in both cases, with higher velocity during inhalation than exhalation. Mouth and nose velocities are 0.6 m/s and 0.3 m/s, respectively, during inhalation, changing to 1 m/s and near 0 m/s during exhalation, indicating a slight increase at the mouth and negligible nasal exhalation compared to the airflow through tracheostomy tube.
_and_pressure_(right)_contours_for_a_human_airway_with_a_deflated_(open)_tr.svg)
In Model B.1, airflow was observed through the oral passage during exhalation, despite the absence of a one-way valve (as seen in Figure 5). This supports a hypothesis suggested in clinical practice, although it has not yet been definitively demonstrated in the literature.
During inhalation, the maximum pressure is 0 Pa near the upper airway, with a minimum pressure of -8.63 Pa at the proximal end of the tracheostomy tube. Pressure within the tube decreases significantly, with the maximum pressure at the proximal end (exposed to atmospheric pressure), contributing to an overall pressure decrease along the tube. During exhalation, the maximum pressure increases to 9.96 Pa at the trachea inlet, with pressure values also increasing at the cuff gap and distal end of the tracheostomy tube. The maximum exhalation pressure is observed at the trachea inlet and the tube outer wall.
2. Model B.2 - Inflated Cuff
Table 4 summarises the velocity and pressure results from simulations of Model B.2, based on the contours in Figure 6. With an inflated tracheostomy cuff, the airway to and from the trachea is cut off from the mouth and nose, directing all airflow via the tracheostomy tube.
During inhalation, the maximum velocity increases to 4.42 m/s, with flow accumulating at the proximal end (ventilator/external side) of the tracheostomy. The airflow within the tube is uniform, with minor velocity reduction at the outer flow boundaries, presenting a distinct flow structure compared to the deflated cuff scenario. During exhalation, air enters the distal end (tracheal side) and exits at the proximal end (external environment). The maximum velocity reaches 4.50 m/s, and overall exhaled flow through the tube is greater than in the deflated cuff scenario. Velocity decreases along the tube length from distal to proximal.
_and_pressure_(right)_contours_for_airflow_through_a_tracheostomy_tube_with.svg)
C. Model C - Human Upper Airway with ACV-delivering subglottic port
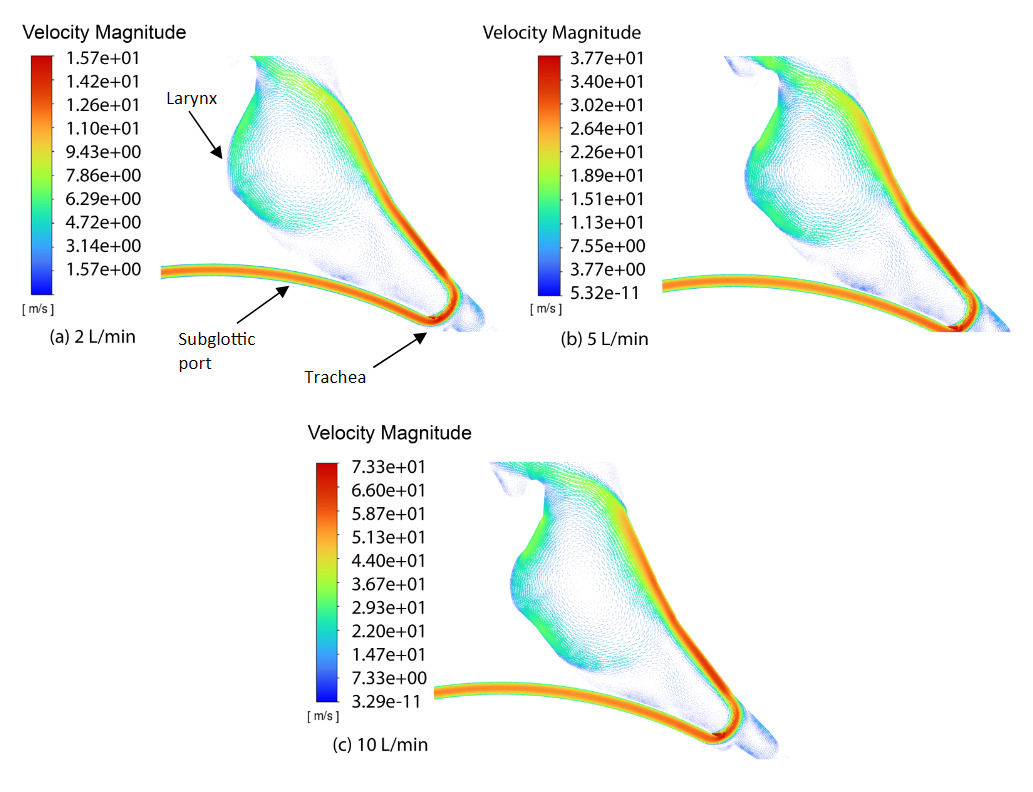
To study Model C, flow rates of 2, 5, and 10 L/min were selected for the 2 mm subglottic tube inlet. Flows between 2 and 5 L/min are commonly used to achieve audible voice with ACV, while 10 L/min was chosen as a clinical upper limit.6,9 With the cuff inflated, exhaled air from the lungs can only pass via the tracheostomy tube, excluding the upper airways. Figure 8 shows the velocity and pressure contours in Model C, illustrating how air at specific flow rates travels through the tube, across the larynx, into the upper airway, and out through the mouth. Airflow through the nose was negligible and therefore is not included in Table 5. Adequate airflow and preserved laryngeal anatomy and function allow the patient to potentially vocalise.
Table 5 summarises the velocity results at different sections of Model C. The calculated tube inlet velocity shows a near-linear correlation with the flow rate. The tube outlet velocity decreases from the inlet to the outlet, indicating a controlled flow pattern within the tube. Notably, the exhaled velocity through the mouth decreases significantly from the tube inlet, indicating potential for controlled vocalisation.
It is notable that the simulated subglottic pressures at 5 L/min flow rate were approximately 240 Pa, which is within the range typically required for phonation threshold pressure (PTP) reported in the literature (approximately 200–500 Pa or ~2–5 cm H₂O).12,13 Additionally, exhaled velocities through the mouth of 3.21 m/s for 2 L/min also fall within ranges described for soft phonation airflow.27,28 Higher flow rates produced significantly greater velocities and pressures, exceeding values typically associated with safe and comfortable phonation.

Comparing the velocity contours in Figure 8 at different flow rates, the flow structures are very similar. This is evident at the location where air circulates in the upper airway, shown by the velocity vectors in Figure 7. Figures 7(a) and (b) show a similar circulation structure compared to the more extensive circulation zone in Figure 7(c). As air curves to enter the oral airway, some moves downwards, following the laryngeal inner wall, creating a wake inside the upper airway. While the soft palate position can influence airflow distribution between the nasal and oral cavities, the nasal airflow was found to be negligible under the conditions modelled and was therefore not represented in the velocity profiles. Figure 7(c) shows how increased flow, and therefore increased velocity, may cause a larger wake to form inside the upper airway, potentially leading to patient discomfort.
_and_pressure_(right)_contours_for_acv_on_a_cuffed_tracheostomy_tube.svg)
IV. DISCUSSION
Our study is the first to use CFD analyses of airway models from human CT scans to characterise airflows during Above Cuff Vocalisation (ACV). Our models were validated against published in-vivo measurements and appear reasonably accurate. Mapping predicted airflows with a tracheostomy tube and gas flow delivered by the subglottic suction port has important implications for tracheostomy tube design, subglottic suction port positioning, and developing safe ACV flow parameters in clinical practice.
ACV is delivered by unregulated pipeline medical gas supply, typically at around 4 bar pressure, which can cause significant harm at higher airflows. By identifying the minimal and optimal flows that produce trans-laryngeal and lip pressures and flows associated with everyday human speech, our study can inform safe operating parameters for ACV delivery in clinical practice. Our results showed that typical speech flows of 1-5 m/s can be reproduced with ACV flows of 2-5 L/min.27,28 These data support current clinical recommendations that ACV flows above 5 L/min are not recommended, as higher flows increase the risks of barotrauma without improving the chances of producing a voice.6,9,17
While clinical studies have established that ACV flows above 5 L/min are potentially harmful, they have primarily reported overall clinical outcomes without providing detailed fluid dynamic explanations. Our CFD simulations uniquely quantify how specific flow rates translate into velocity magnitudes, pressure gradients, and turbulence patterns across subglottic and supraglottic regions. This provides a mechanistic understanding of the physical forces involved in ACV and their potential effects on phonation, mucosal health, and patient safety. For example, we observed that flows exceeding 5 L/min generated substantially higher velocities and turbulent wakes in the upper airway, which could interfere with stable vocal fold oscillation and increase the risk of tissue trauma. These insights help explain why lower flow rates are clinically safer and more effective, thus bridging the gap between empirical clinical findings and underlying airway physics.
Clinically, these findings can inform the development of safer ACV protocols by predicting airflow conditions that minimise tissue trauma and optimise phonation. Future work should also investigate patient-specific models, as anatomical differences and pathologies could significantly influence safe flow thresholds and acoustic outcomes. Moreover, integrating dynamic vocal fold motion into CFD simulations could further improve understanding of phonatory mechanics during ACV.
Our CFD results align with published data suggesting that phonation threshold pressures generally range from 2 to 5 cm H₂O (approximately 200–500 Pa).12,13 At ACV flows of 2-5 L/min, our simulations showed subglottic pressures and airflow velocities consistent with these thresholds, supporting the feasibility of achieving phonation without excessive airflow that could risk barotrauma or tissue trauma. Conversely, flows of 10 L/min generated higher velocities and turbulent wakes, potentially exceeding safe physiological ranges. This provides a mechanistic explanation for current clinical recommendations limiting ACV flows to ≤5 L/min.6,9,17 Our study thus bridges the gap between empirical phonation thresholds and detailed airflow dynamics, helping to inform safer ACV protocols.
Our results also highlight important clinical risks associated with different ACV flow rates. While flows around 2 L/min appear sufficient to achieve phonation without excessive turbulence, higher flow rates may produce jet-like velocities and increased shear stresses that risk mucosal trauma, drying of airway surfaces, and discomfort for patients. These findings reinforce recommendations to avoid exceeding 5 L/min during ACV.6,9,17
There may also be significant variability across patient populations. For example, paediatric patients have smaller airway dimensions and lower tissue tolerance, which may lower safe airflow thresholds. Elderly patients or those who have undergone radiation therapy may have more fragile mucosal surfaces or structural changes affecting airflow. Personalised approaches to ACV, potentially guided by patient-specific CFD modelling, may help determine optimal safe flow rates for these groups.
Regarding device design, our CFD simulations suggest that multiple subglottic ports, smaller port diameters, or altered port geometries could help distribute airflow more evenly, reducing local high-velocity jets and turbulence. Such design innovations could improve safety and patient comfort, facilitating broader clinical adoption of ACV. Future tracheostomy tube designs may also incorporate adjustable flow controls or feedback systems to maintain flow within safe ranges for diverse patient populations.
Our CFD simulations revealed that higher flow rates from a single subglottic port produce high-velocity jets and localised turbulence in the upper airway, which could increase the risk of mucosal trauma and compromise voice quality. This suggests that future tracheostomy tube designs might benefit from multiple smaller subglottic ports or optimised port geometries. Such configurations could distribute airflow more evenly, reducing localised high velocities and turbulence while maintaining adequate overall flow for phonation. These design changes could help achieve effective vocalisation at lower, safer flow rates, thereby reducing the risk of barotrauma and enhancing patient comfort.
A. Limitations of Study
This study employs a 2D midline slice model to focus on core transglottic airflow dynamics, which can be adequately captured in the sagittal plane. While 3D models offer higher anatomical resolution, the 2D approach provides a reasonable initial exploration with reduced computational demand, yielding insights relevant for initial clinical applications. Although this study does not claim to be a complete real-world representation, the values generated are consistent with those reported in the literature derived from adult human experiments, providing a high degree of confidence in the representativeness of our results. Minor discrepancies between our results and experimental data are attributed to the simplifications inherent in the two-dimensional representation of the anatomy.
Additionally, our study utilises adult male CT scans to generate the airway models. Future replications should include female airway models and disordered anatomy models, often seen post-intubation in ICU patients. Despite these limitations, valuable conclusions were drawn from the tracheostomy tube and ACV simulations. This study elucidates how air enters and exits a human airway with an inserted tracheostomy tube during inhalation and exhalation, focusing on airflow at the nose, mouth, and tracheostomy tube, thereby providing insights into the differences between inflated and deflated cuff cases.
A key limitation of this study is the use of 2D modelling, which cannot fully capture lateral flow patterns, three-dimensional turbulence structures, or asymmetric vocal fold dynamics present during phonation. However, we selected a 2D approach to allow efficient simulation of mid-sagittal flow characteristics and to conduct preliminary analyses with manageable computational resources. Previous research has demonstrated that 2D models can approximate important airflow behaviours in the upper airway and provide useful insights for initial studies.19,26 Future work will extend this modelling to full 3D simulations for greater anatomical and physiological accuracy.
V. CONCLUSION AND FUTURE WORK
This study successfully utilised Computational Fluid Dynamics (CFD) simulations to characterise the fluid flow properties of air delivered via the subglottic port of a tracheostomy tube employed in clinical practice for Above Cuff Vocalisation (ACV). Our findings indicate that the 2D model effectively predicts values for the mouth pressure and velocity, consistent with clinical observations, validating its applicability in preliminary studies.
Although published three-dimensional CFD investigations of non-ACV tracheostomy airflows report similar data to our study, in-vivo animal or human experiments to directly measure ACV flows and pressure levels via the subglottic port are challenging.
The findings provide foundational insights into airflow dynamics in tracheostomised patients, particularly those managed with ACV. By offering a detailed understanding of subglottic and above-cuff airflow patterns, this research contributes to the optimisation of tracheostomy tube design and the development of clinically effective ACV techniques. The clinical implications of this work are significant. By advancing our understanding of airflow dynamics during ACV, these simulations have the potential to inform the optimal selection of tracheostomy tubes and guide personalised clinical decision-making. Furthermore, future research could define safe and effective operating parameters for ACV systems and devices, reducing risks such as airway trauma or suboptimal ventilation.
Future work should aim to build on these findings by incorporating patient-specific anatomical details derived from CT scans of representative individuals with tracheostomies. This would enable the creation of 3D models that reflect more anatomically accurate features, improving the reliability and clinical applicability of the simulations. Exploring the variability introduced by different tracheostomy tube brands and designs, including variations in inner cannula sizing and structural geometry, is another critical avenue for future investigation. These factors could significantly influence airflow dynamics and, consequently, ACV performance. Additionally, the model should be adapted to include more complex and clinically relevant conditions, such as airways affected by vocal cord paralysis, pharyngeal oedema, or partial airway obstructions. Such adaptations would allow for the study of disordered airflow and the identification of optimal strategies for phonation in challenging scenarios. Incorporating dynamic factors such as vocal cord function,29 airway compliance, and the presence of pathological features could offer tailored insights into the airflow requirements for phonation in different patient populations. Furthermore, while our study focused on cuffed tracheostomy tubes, future research could explore the application of CFD simulations in dysphagia studies,30,31 particularly in uncuffed scenarios, to enhance clinical understanding and practices related to swallowing disorders.
Tracheostomy tubes are primarily designed to aspirate secretions, with several design variations available from different manufacturers. ACV is currently delivered via the same suction port but with retrograde flow. Our models may help determine the optimal position of the ACV port in future tube designs, which is likely different from the optimal position for drainage of tracheal secretions. There might be a design trade-off for optimal port positioning, or future tubes may have two ports – one for drainage and one for ACV. We believe our research can drive the optimal design of tracheostomy tubes to better facilitate vocalisation.
In summary, this CFD study complements existing clinical evidence by providing, for the first time, a physics-based quantification of airflow dynamics during ACV, offering mechanistic insights into why lower flow rates are optimal for safe and effective phonation in tracheostomised patients.