Introduction
An estimated 100,000 or more tracheostomies are performed each year in the United States, most commonly for acute respiratory failure with prolonged mechanical ventilation.1–3 Tracheostomies confer a significant economic burden on the health care system, with one study reporting average hospital costs of $155,469 for patients undergoing tracheostomy.4 Several factors may contribute to the high costs associated with tracheostomy, including underlying critical illness, prolonged hospital stays, complications, readmissions, and multidisciplinary, resource-intensive care.4–7 Although several studies have quantified hospital costs or charges associated with tracheostomy in the United States,4,8,9 there is a paucity of data on the cost burden faced by patients undergoing tracheostomy.
In an international survey administered by the Global Tracheostomy Collaborative, which included health care providers, patients, and caregivers, “challenges with affordability” were ranked as one of the top concerns regarding tracheostomy care.10 Specific challenges with affordability included the cost of equipment/supplies,11 inadequate insurance coverage, and travel burden.10 Furthermore, the implications of tracheostomy care for personal employment and for family caregivers can increase financial strain. However, to our knowledge, no studies have quantified out-of-pocket (OOP) costs for adults undergoing tracheostomy in the United States. A better understanding of OOP costs related to tracheostomy would help guide patient/family counseling and inform interventions to improve affordability.
The tracheostomy population may be particularly vulnerable to surprise billing due to several unique characteristics. Tracheostomies are often performed emergently in critically ill patients who cannot choose their providers or verify insurance coverage. The procedure also requires a team of multiple specialists including surgeons, anesthesiologists, intensivists, and respiratory therapists, and this increases the chance that some providers will be out-of-network even when the primary surgeon and hospital are in-network.12,13
The No Surprises Act, a federal law aimed at protecting consumers from unexpected medical bills, took effect on January 1, 2022.14 This law prohibits certain out-of-network providers from billing patients for the difference between their charges and what the insurance pays. However, little is known about costs borne by patients in this context. To help address this gap, we used the Merative MarketScan database to evaluate 30-day OOP costs for adults undergoing tracheostomy in the United States from 2014 to 2022. We also analyzed the prevalence of potential surprise bills, which are out-of-network charges faced by patients despite having a primary surgeon and facility within their insurance network.15 Based on literature for other surgical specialties, we hypothesized that the median OOP costs would exceed $1000 per surgical episode, which would surpass the typical reserve fund for many adults.16
Methods
This study was reviewed by the University of Michigan Institutional Review Board and deemed not regulated on the grounds that it used a de-identified publicly available dataset (IRB#: HUM00227012).
Data Source and Cohort Selection
This retrospective cohort study analyzed claims data to evaluate out-of-pocket costs and surprise billing patterns among commercially insured adults undergoing tracheostomy. We identified individual claims from the Merative MarketScan Commercial Database.17 The MarketScan database contains de-identified billing data for over 250 million patients with commercial insurance plans in the United States from 2007 to 2022. It represents all 50 states and approximately 350 private, employer-sponsored payers representing diverse healthcare settings including academic medical centers, community hospitals, and specialty facilities. We attempted to minimize selection bias by utilizing this nationally representative insurance claims database. MarketScan collects data on paid claims from individual payers about 6 months after the end of the calendar year to ensure that the majority of paid claims are captured.
We included patients who underwent tracheostomy between January 1, 2014 through December 31, 2022 and were between 18 and 64 years old at the time of surgery. Patient recruitment was passive through insurance claim submissions, with exposure periods defined as the surgical date, and follow-up extending 30-days post procedure. Patients over 64 years of age were excluded due to potential confounding by Medicare eligibility. Patients who underwent tracheostomy classified as “outpatient” were excluded. We used CPT codes “31600” (planned tracheostomy) and “31603” (emergent tracheostomy) to identify our sample.
To ensure the analytic cohort’s completeness and the claims data’s integrity, we implemented predefined systematic screening criteria. We limited our cohort to patients with continuous enrollment in their insurance plan for at least 3 months before and at least 3 months after the day of surgery. Only claims with coinsurance, deductibles, or copays greater than or equal to $0 were included. To capture all potentially relevant claims, we defined a surgical episode to include all claims from the date of surgery to 30 days after surgery. This includes any professional and facility claims within the 30-day postoperative period, maximizing the sensitivity for including relevant costs at the risk of including some costs not directly attributable to tracheostomy. The rationale for limiting the analysis to claims within 30 days after surgery was based on prior literature examining short-term out-of-pocket costs after surgery, facilitating comparison across studies. Claims beyond the 30-day window are less likely to be attributable to the procedure itself and are outside the scope of this study. Surgical episodes without at least one professional and one facility claim were excluded. We aggregated claims data into patient-specific, encounter-level data based on the 30-day surgical episode definition. In this analysis, the “primary surgeon” was defined as the provider who submitted the charge/CPT code for the procedure. Encounters with missing data on network status (in-network vs. out-of-network) for claims involving the primary surgeon or facility were excluded from the surprise billing analysis.
Primary Outcomes and Exposure Variables
Our primary outcomes were OOP costs and potential surprise bills. OOP costs were defined as the sum of coinsurance, deductibles, and copays for a surgical episode. A potential surprise bill was defined as an out-of-network claim for a surgical episode where both the primary surgeon and facility were classified as in-network. Insurance plans were categorized as fee-for-service, high-deductible health plans, or managed care plan, consistent with other relevant studies in current literature.18 Year of surgery was categorized as 2022 versus 2014-2021 to facilitate hypothesis testing related to timing of the No Surprises Act.
Statistical Analysis
Variables in the final encounter-level datasets were examined for missing data and all were missing <5% of observations. All OOP costs were adjusted for inflation based on 2024 dollars using the consumer price index.19 Cost data were winsorized to the 1st and 99th percentiles to account for the effects of outliers. We used non-parametric testing and median interquartile range (IQR) for all analyses because the cost data were right skewed.
We used Wilcoxon rank sum tests to compare OOP costs based on whether a patient had a potential surprise bill. We used generalized linear regression models on log-transformed cost data to evaluate associations with total 30-day OOP costs. Back-transformation was used to obtain cost-ratios, which represent the multiplicative change in total 30-day OOP costs relative to the reference exposure group. Cost-ratios were used because they provide an intuitive interpretation of the relative difference between groups while maintaining statistical validity after log transformation (e.g. a cost ratio of 1.5 indicates costs are 50% higher); this is also consistent with prior studies using the Marketscan database,20 facilitating comparison across studies. We used logistic regression models to evaluate associations with having a potential surprise bill. Adjustment for potential confounders or effect modifiers was not performed given the exploratory nature of our study and paucity of literature on variables associated with surprise billing and OOP costs in tracheostomy. We used SAS software version 9.4 (Cary, NC) for all analyses, and significance was set at p<0.05.
Results
There were 8,950 adults aged 18 to 64 years who underwent tracheostomy in the United States from 2014 to 2022 that met predefined criteria for inclusion in our sample. Most tracheostomies were planned (n=8,629; 96.4%); 321 (3.6%) were unplanned/emergent. Baseline characteristics are summarized in Table 1. The mean (SD) age of patients in our sample was 49.3 years (12.7) and 61.8% were male. Most patients had a fee-for-service based insurance plan (79.8%) and were considered actively employed (58.0%) prior to undergoing tracheostomy.
The data analysis identified both the magnitude and key drivers of OOP costs associated with tracheostomy placement. Table 2 presents the costs related to tracheostomy placement. The median (IQR) total 30-day OOP cost was $590 (0 to 1932), and the mean (SD) total 30-day OOP cost was $1423 (2029). Coinsurance accounted for 62.8% of total 30-day OOP costs.
Significant predictors of total 30-day OOP costs are summarized in Table 3. The strongest predictors for OOP costs were high-deductible health plan (cost-ratio 2.66, 95% CI 2.25 to 3.14; p<0.001 vs. managed care plan), fee-for-service plan (cost-ratio 1.84, 95% CI 1.64 to 2.07; p<0.001 vs. managed care plan), and emergent tracheostomy (cost-ratio 1.82, 95% CI 1.51 to 2.20; p<0.001).
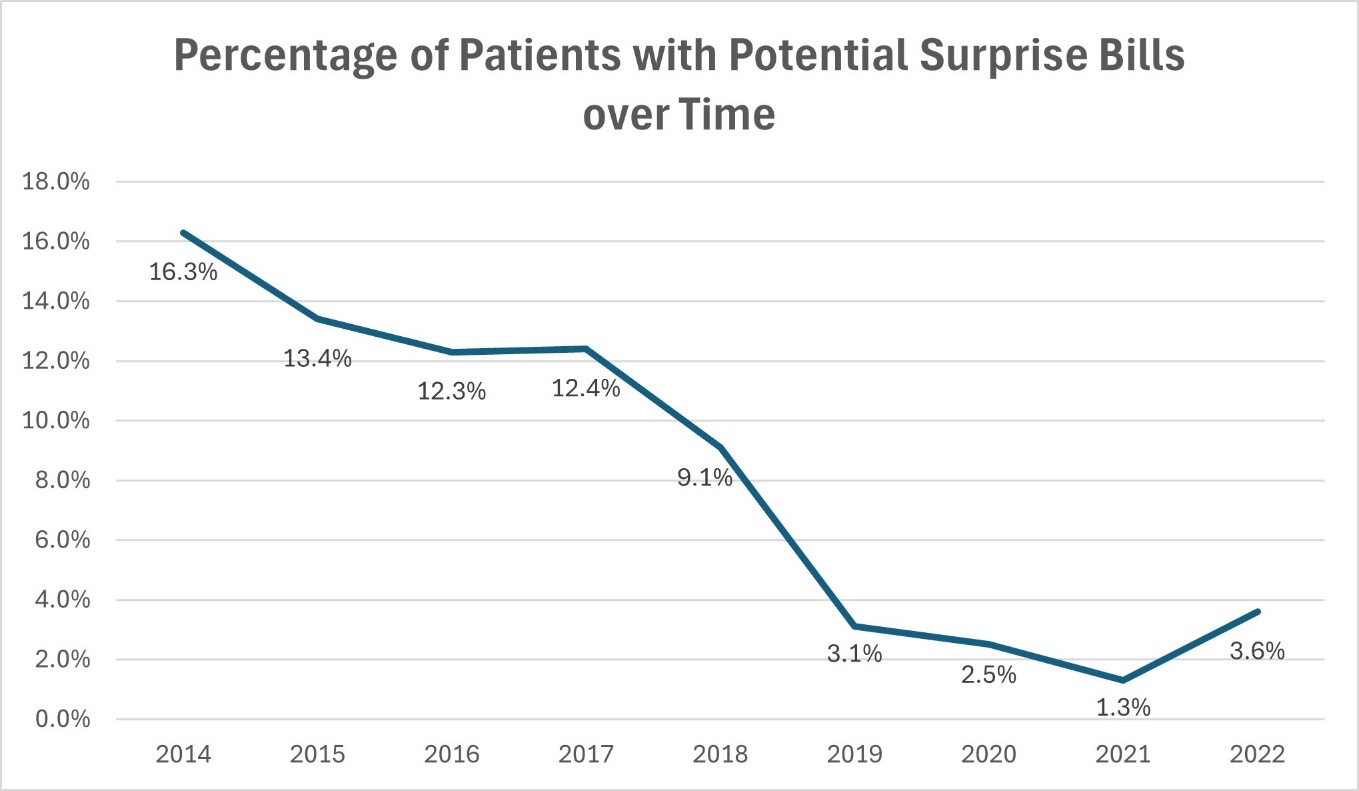
Of 7,945 patients who underwent tracheostomy with data available for surprise billing analysis, 723 patients (9.1%) had a potential surprise bill. The frequency of potential surprise bills decreased over the study period (Figure 1).

The median (IQR) total 30-day OOP costs were significantly higher in patients with a potential surprise bill than those without ($989 [203 to 2705] vs. $623 [0 to 2004]; p<0.001). The mean (SD) total 30-day OOP costs were also significantly higher in patients with a potential surprise bill than those without ($1909 [2433] vs. $1444 [2021]; p<0.001).
Significant predictors of having a potential surprise bill are summarized in Table 4. Having a high-deductible health plan (OR 2.07, 95% CI 1.34 to 3.20; p<0.001 vs. managed care plan) or a fee-for-service plan (OR 2.78, 95% CI 2.00 to 3.87; p<0.001 vs. managed care plan) were the strongest predictors of a potential surprise bill. Furthermore, “retired” patients were more likely to receive surprise bills (OR 1.56, 95% CI 1.13 to 1.87; p=0.004) despite lower total 30-day OOP costs (OR 0.55, 95% CI 0.48 to 0.62; p<0.001) compared to fully employed patients.
When analyzing the claims-level data, 114,431 of 1,068,467 claims (10.7%) were classified as a potential surprise bill. Most claims classified as a potential surprise bill were professional claims (n=114,026, 99.7%). The top 3 sources of professional claims classified as potential surprise bills were surgeon “not elsewhere classified” (30.0%), otolaryngology (23.9%), and thoracic surgery (8.1%).
Discussion
Our analysis of OOP costs and potential surprise bills faced by adults undergoing tracheostomy in the United States provides novel insights into an understudied aspect of the patient experience and can inform future work aimed at improving the affordability of tracheostomy care. Median and mean total 30-day OOP costs for tracheostomy were $590 and $1423, respectively, illustrating the variable and unpredictable nature of OOP costs with the potential for high-cost outliers. These mean costs are comparable to those reported for other high-cost surgical procedures including neurosurgical and orthopedic procedures, with mean costs ranging from $1400 to $3000, particularly among patients with high-deductible health plans.21,22 In our analysis, insurance plan type was the strongest predictor of both OOP costs and surprise bills, a finding which can inform patient/family counseling as well as policy reform. Potential surprise bills were associated with higher OOP costs, although their frequency decreased in recent years within our sample.
Although tracheostomy is known to confer high costs to the health care system, far less is known about the financial implications for patients. The mean OOP cost in the 30-day surgical episode following tracheostomy was $1,423. OOP medical costs are a leading source of bankruptcy in the United States and can contribute to considerable financial strain for patients, leading to poor quality of life and non-adherence with medications or other care.23–25 A 2023 study found that 42% of adults were unable to afford more than $1000 in emergency expenses using savings,16 suggesting that tracheostomy may exceed the reserve funds for many patients. Coinsurance, which Americans poorly understand,26 was the largest contributor to OOP costs; therefore, even patients who have met their deductibles may bear unexpected OOP costs.
Our findings capture OOP costs faced by patients undergoing tracheostomy in the initial 30-day postoperative period and likely underestimate the long-term financial strain and indirect costs faced by patients and their families. For example, it is not uncommon for hospital length of stay following tracheostomy to exceed 30-days,4,27,28 especially in patients with underlying respiratory failure and ventilator dependence.29 Furthermore, many patients require prolonged stays in skilled nursing or rehabilitation centers following hospitalization.30 Other costs may include lost earnings/joblessness,31 durable medical equipment,11 and travel burden.10 More studies are needed to understand the long-term financial impact of tracheostomy on patients and their families.
Nearly 10% of patients in our sample had a potential surprise bill, similar to other work using the MarketScan database.32 Surprise bills are most likely to occur when out-of-network providers such as anesthesiologists or pathologists are involved in patient care despite having an in-network primary surgeon and facility.15,33 Although potential surprise bills in our study were associated with higher total 30-day OOP costs, their frequency decreased over the study period. The downward trend in potential surprise bills roughly coincided with the discussion and passage of the No Surprises Act in 2020.14 Although the law was not effective until 2022, the trend may reflect anticipatory changes in billing practices given pending legislation and growing public discontent with balance billing practices. These possible anticipatory changes may include proactive contract negotiations with ancillary providers, improved care coordination systems that better track provider network status, and internal policies to minimize out-of-network billing during emergency procedures like tracheostomy. Additionally, there was an expansion of state-level policies against surprise billing enacted prior to the No Surprises Act.34
In our study, insurance type, specifically high-deductible health plans and fee-for-service based plans, was the major driver of both OOP costs and potential surprise bills. While the association between HDHPs and higher OOP costs is expected given their benefit design, the relationship between HDHPs and increased surprise bills is less intuitive, as surprise bills are traditionally associated with narrow network plans. This unexpected finding may be explained by factors unique to the tracheostomy setting. First, although HDHPs often offer broader networks, this can lead to confusion about which providers are in-network, especially in emergency settings. Second, tracheostomy care involves many specialists, increasing the chance that at least one is out-of-network, regardless of insurance design. Although HDHP’s may afford some protection against surprise bills for elective procedures, this may be less applicable for urgent or emergent surgeries with many different providers involved.35,36
Insurance is challenging for patients to navigate, particularly in the tracheostomy setting associated with high medical complexity and comorbidity.11,26 Tracheostomy care requires complex interprofessional coordination, which may also predispose to challenges in care coordination and unanticipated costs.37–39 One solution that could help mitigate some of the financial strain felt by patients, families, and caregivers surrounding tracheostomy is implementing financial navigators. Financial navigators can help patients to understand treatment costs, optimize insurance coverage, and identify resources such as financial assistance programs, credit management, and job protection policies.40,41 Financial navigators are increasingly popular in oncology clinics and have been found to reduce financial hardship for patients and improve quality of life.40,42,43 Financial navigation has also proved successful in primary care and specialty clinic settings.44 The complexity of critical care and the high financial burden surrounding tracheostomy suggest a potential role for investigating models of financial navigation. Other modifiable factors include the timing of tracheostomy in the setting of prolonged ventilatory needs. Studies have found that early tracheostomy is associated with decreased hospital costs.9,45 Although tracheostomy timing was not captured in our database, future research is warranted to evaluate the relationship of tracheostomy timing with OOP costs and surprise bills.
Our study has several limitations. Given that MarketScan captures commercial insurance, our study is not generalizable to patients with Medicaid or Medicare, or adults over 65 years of age, who represent a sizable proportion of the population undergoing tracheostomy. Furthermore, the costs in our study represent short-term (30-day) direct costs to patients and do not capture the long-term and indirect costs following tracheostomy. Long-term costs related to tracheostomy are an important topic but were outside the scope of this study; such an analysis might be feasible but would require a different data-cleaning process with more specific claims limited to tracheostomy care. The finding that median deductible payments were $0 suggests that many patients had already met their annual deductible through facility payment for hospitalization, leading to an underestimation of the true OOP costs associated with tracheostomy. Additionally, our exclusion of outpatient tracheostomy cases, while clinically appropriate given most tracheostomies are performed in inpatient settings for critically ill patients, may underestimate the cost variability as outpatient procedures could represent a different cost profile. While the MarketScan database allowed detection of potential surprise bills, data on the magnitude of surprise bills and whether the bill was sent to the patient were unavailable. There are also several unmeasured variables, including patient comorbidities, hospital or intensive care unit length of stay, disposition (e.g. long-term care facility), and surgical complications. By limiting our analysis to short-term costs, we aimed to minimize confounding due to variability in patient disposition.
Despite these limitations, our study offers insight into the financial challenges faced by patients undergoing tracheostomy, an area that has received only limited attention in the medical literature. By highlighting the short-term OOP costs and identifying insurance-related drivers of financial burden and surprise billing, we provide a foundation for targeted interventions to enhance transparency, improve patient counseling, and reduce preventable hardship. As individuals undergoing tracheostomy and their families navigate complex, high-stakes care, understanding and mitigating adverse financial implications can improve health equity and outcomes. This work lays the groundwork for future studies to capture the full scope of economic burden across the tracheostomy care continuum and translate those insights into action.
Acknowledgements
Assistance with Study: The authors would like to thank Patrick Brady for his guidance and expertise regarding the MarketScan data.
Financial support and sponsorship
Nicholas R. Lenze was supported by the Michigan Otolaryngology Research Education (MORE) NIH R25 research grant (DC020262) and the Centralized Otolaryngology Research Efforts (CORE) grant for this project. Dr. Chhabra is supported by an NYU CTSA grant (KL2 TR001446) from the National Center for Advancing Translational Sciences, National Institutes of Health."
Conflicts of interest
None
Presentation
None